

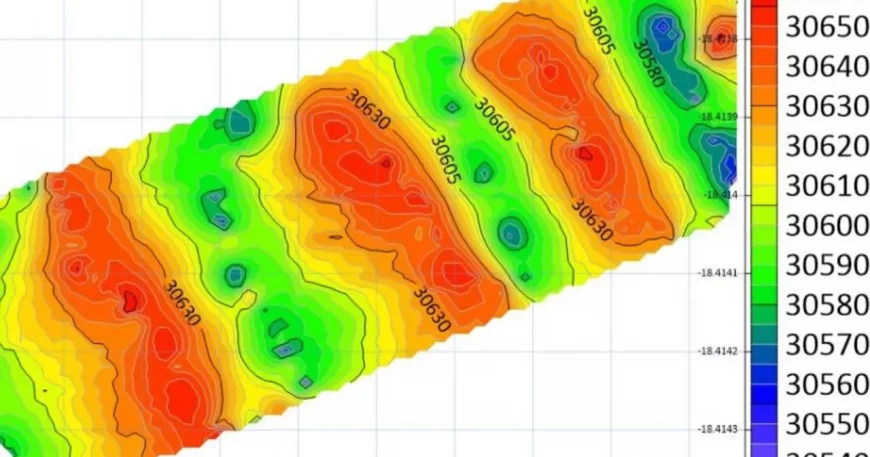
A magnetic field intensity map for a local area is used in geological and mineral exploration to detect subsurface features. These maps are created using magnetometer readings taken systematically over a grid.
What the Survey Map Shows:
• Contours or color gradients represent changes in magnetic field strength (MFI) in nT.
• High MFI zones (often red/dark):
– Indicate magnetic minerals like magnetite
– May point to mineralized zones, dykes, or faults
• Low MFI zones (blue/light):
– Suggest non-magnetic rocks, sediments, or weathered structures
Magnetometer Use:
Measures the total magnetic field at a point
• Readings range: 20,000–70,000 nT
• Logged every 5–10 meters in surveys
• Data is processed into maps using GIS or geophysical software